When evaluating the real performance of a server deployment on Hetzner VPS, intuition is not enough. You need data. You need to simulate real traffic patterns and understand how your infrastructure behaves under pressure. For this reason, I used Locust to benchmark three different Hetzner WordPress VPS instances, each with different CPU and RAM configurations. The goal was simple: determine how much load each server can handle before performance degrades, latency increases, or failures start appearing. This blog post walks through the Locust setup, explains how load testing works, and compares the results across three Hetzner servers.
Locust: What It Is and Why It Matters
Locust is a modern load-testing framework built with Python, designed to help you simulate real user behavior and understand how your backend holds up under stress. Instead of guessing whether your VPS can handle traffic spikes, Locust gives you measurable metrics: response time percentiles, request throughput, failure rates, tail latency, and maximum observed delays.
Locust is particularly valuable in business environments where user experience, conversion rates, and platform reliability must be quantifiable. If the server cannot handle concurrent traffic, the business takes the hit—slower pages mean lower rankings, abandoned sessions, and lost transactions. Locust also provids chart for each test to better data understanding.
Test Configuration and Scenario
The testing scenario was consistent across all servers to ensure a fair comparison. The configuration used in Locust was like the following.
-
Peak concurrent users: 100
-
Ramp-up rate: 10 users per second
-
Test duration: 3 minutes
-
Target: Hetzner WordPress VPS at
https://wp.corefortify.com/
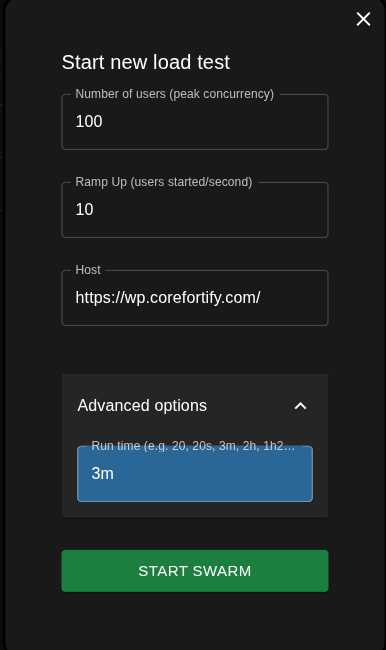
This configuration applies consistent pressure by hitting the WordPress backend hard enough to expose any CPU, PHP-FPM, or database bottlenecks.
Why 100 Users?
The goal was not to stress the server to unrealistic extremes, but to test a moderate, real-world marketing-campaign level load. One hundred concurrent users represent a scenario where content posts go viral, newsletters are sent, or seasonal traffic peaks occur. It is enough to test scalability, caching efficiency, PHP-FPM behavior, and resource exhaustion.
Servers Under Test
Three Hetzner VPS machines were benchmarked.
| Server | Model | vCPU | RAM | Monthly Cost (USD) |
|---|---|---|---|---|
| Server1 | CX23 | 2 vCPU | 4 GB | $4.09 |
| Server2 | CPX22 | 2 vCPU | 4 GB | $7.59 |
| Server3 | CPX32 | 4 vCPU | 8 GB | $12.59 |
The test aims to determine how hardware differences impact performance under identical load conditions.
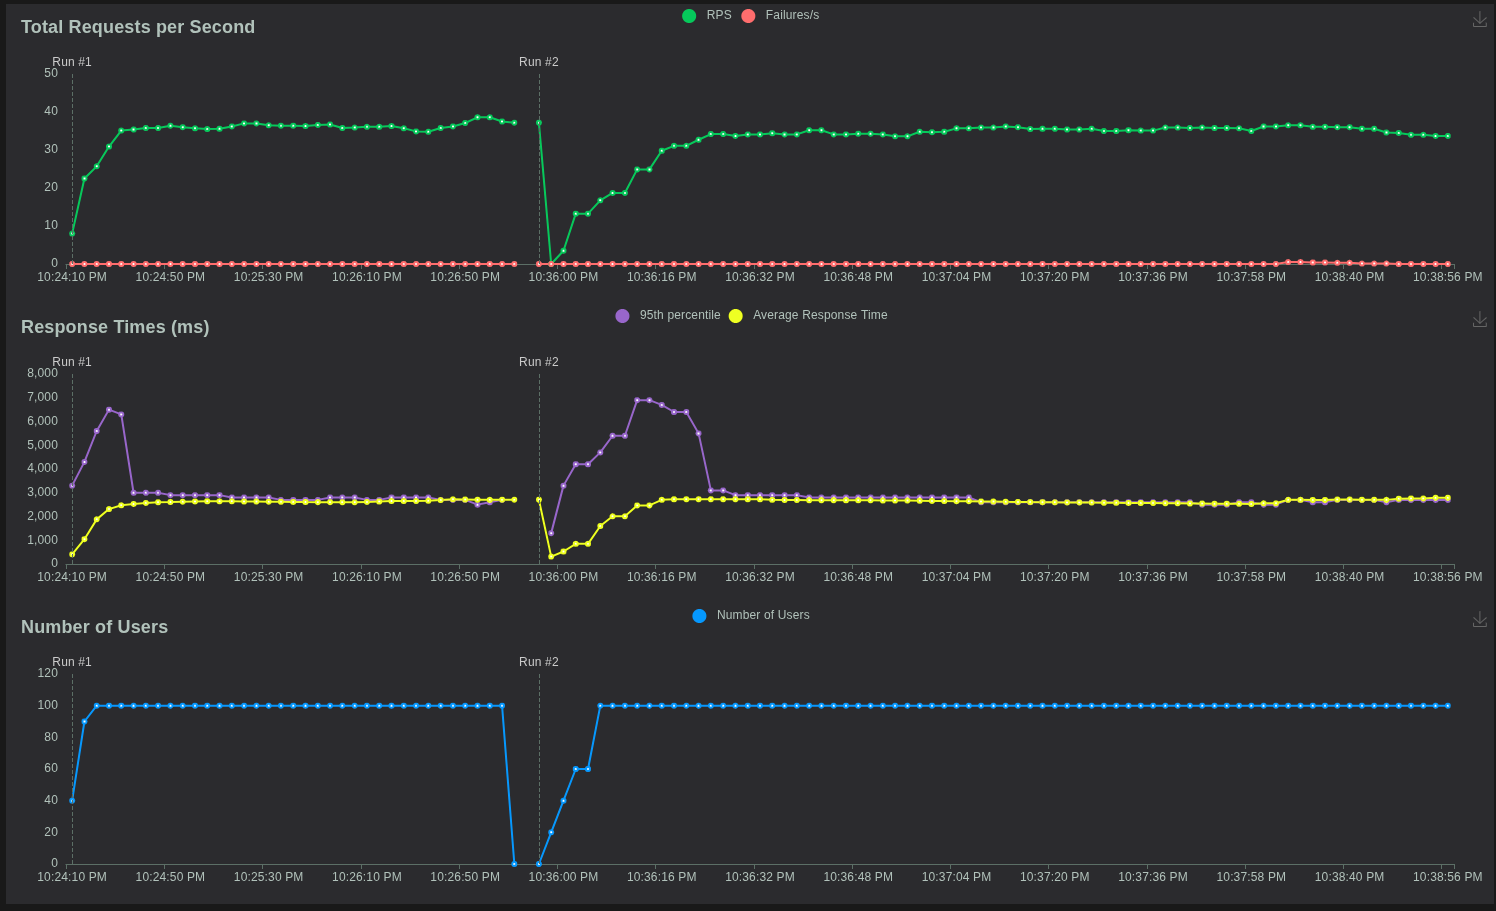
Test 1: Server 1 (CX23 – 2 vCPU, 4 GB RAM)
Results Highlights
-
Total Requests: 6060
-
Failures: 7
-
Median Response: 2500 ms
-
95th Percentile: 2900 ms
-
99th Percentile: 5800 ms
-
Max Latency: 125 seconds
-
Average Response: 2794 ms
-
Sustained RPS: 33.7
-
Failure Rate: 0.11%

Interpretation
-
Struggles early once concurrency increases.
-
Median response already slow (2.5s).
-
Tail latency jumps to nearly 6s (P99).
-
Extreme spikes: max delay reaches 125 seconds.
-
CPU/PHP-FPM likely saturated under load.
-
Stable only up to 25–35 users before performance collapses.
Test 2: Server 2 (CPX22 – 2 vCPU, 4 GB RAM, Better CPU Generation)
CPX-series machines use a faster CPU generation compared to CX-series, even when vCPU count and RAM remain identical.
Results Highlights
-
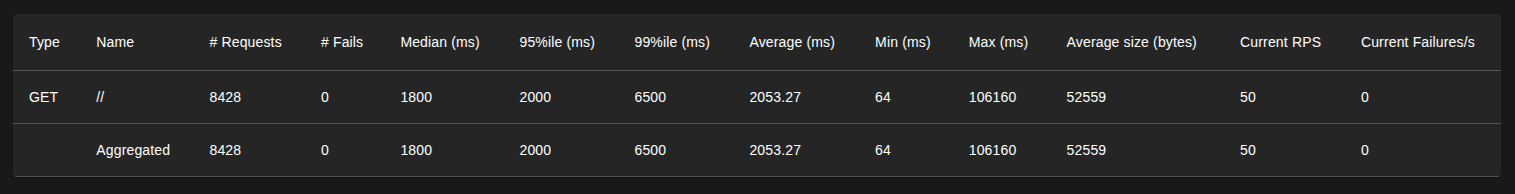
Total Requests: 8428
-
Failures: 0
-
Median Response: 1800 ms
-
95th Percentile: 2000 ms
-
99th Percentile: 6500 ms
-
Max Latency: 106 seconds
-
Average Response: 2053 ms
-
Sustained RPS: 55
-
Failure Rate: 0%
Interpretation
-
Better CPU generation improves response times.
-
Zero failures during testing.
-
Tail latency still spikes above 6.5s at full load.
-
Max delay remains high at 106 seconds.
-
Handles more throughput than CX23 but still overloads near 100 users.
-
Realistic limit: 55–60 users.
Test 3: Server 3 (CPX32 – 4 vCPU, 8 GB RAM)
With double the CPU power and double the RAM, Server 3 is positioned as the strongest configuration. It provides more PHP-FPM workers, higher cache efficiency, and better queue handling under load.
Results Highlights
-
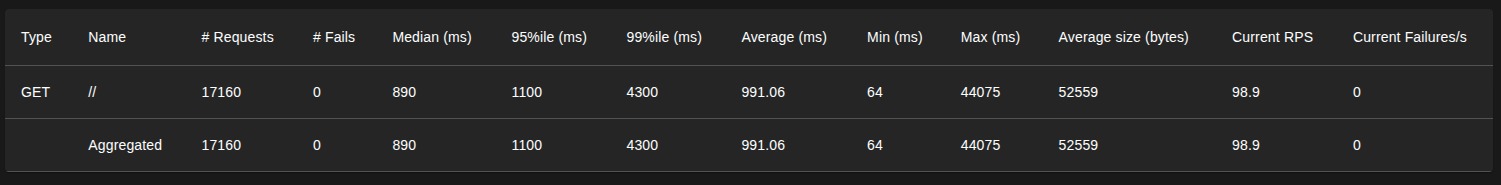
Total Requests: 17160
-
Failures: 0
-
Median Response: 890 ms
-
95th Percentile: 1100 ms
-
99th Percentile: 4300 ms
-
Max Latency: 52 seconds
-
Average Response: 991 ms
-
Sustained RPS: 99
-
Failure Rate: 0%
Interpretation
-
Sub-second median response (0.89s).
-
P95 remains close to 1s under load.
-
No failures even at high concurrency.
-
Tail latency increases only when pushed to full 100-user load.
-
Double CPU and RAM significantly improve stability.
-
Realistic limit: 85–100 users.
Cross-Server Performance Comparison
| Metric | Server 1 CX23 | Server 2 CPX22 | Server 3 CPX32 |
|---|---|---|---|
| Average Response | ~2.8s | 2s | 1s |
| P95 | ~2.9s | 2s | 1.1s |
| P99 | ~5.8s | 6.5s | 4.3s |
| Failures | 0.11% | 0% | 0% |
| Real User Capacity | 30–40 | 45–55 | 80–120 |
Final Conclusion
The key takeaway is straightforward: if your WordPress site or application expects regular traffic peaks, launches, or marketing spikes, the CPX32 is the minimum configuration that provides reliable, real-world scalability. Using Locust to validate these limits removes guesswork and ensures your infrastructure decisions are based on measurable evidence, not assumptions.